homepage
sports
cricket is one of the best sports on Earth. the tension, the drama, the skill, the stats, the drinking. it has truly got something for everybody.
in this page i will put some of the interesting cricket stats ive found.
last updated: 22/12/25
Test Batting
for starters i scraped all individual test batting innings from espncricinfo (goated website). this includes every test innings from every batsmen including ICC World XI matches.
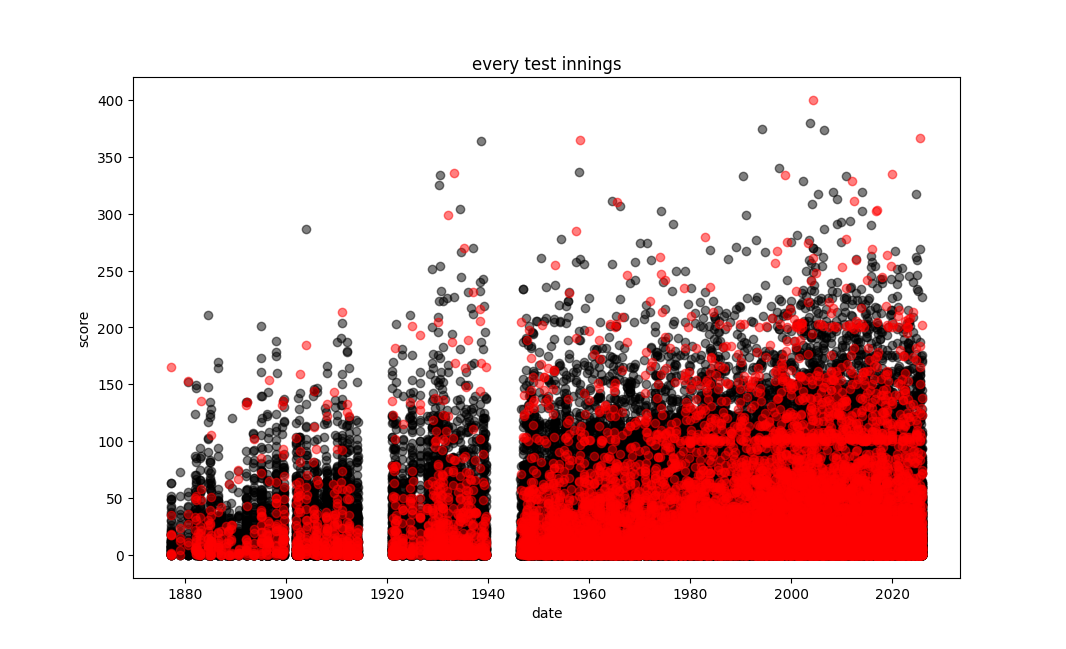
this is a cool starting place. so ive plotted not out innings in red, out in black. immediately i look to the top and see Brian Lara's 400* in 2004 and the massive gaps when the world wars were on.
the next thing i see, is the lines of not out at 100 and 200. this makes a lot of sense captains will let there batsmen get 100*/200* before declaring.
finally, there appears to be a general trend upward, this could be due to a few things: better bats, more games with more nations, the improvement of tail enders batting.
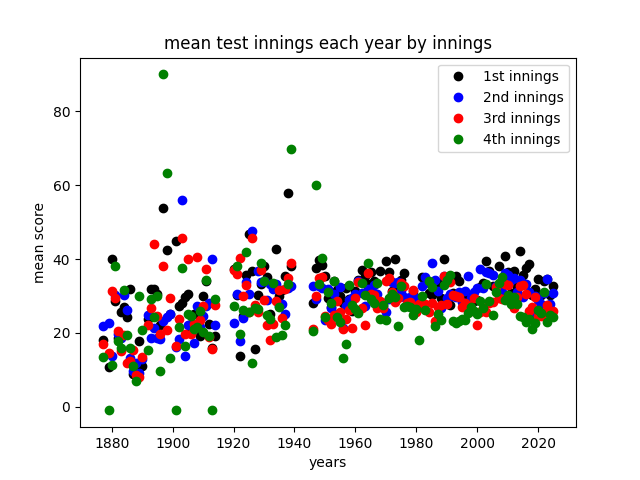
we can check further this last point by looking at the mean score each year.
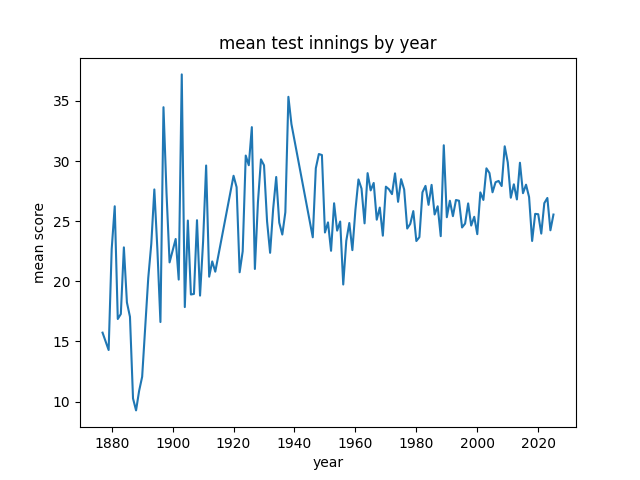
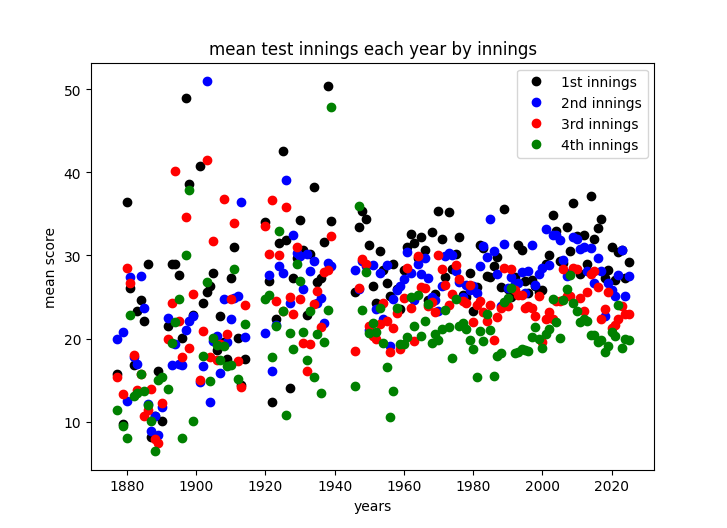
looking at these graphs, the difference before and after ww2 is clear. after the mean score by innings is generally 1st > 2nd > 3rd > 4th, and they all follow a similar trend.
before they are all over the joint. in 1939 the 4th innings average was 47.9 more then 15 better then the 1st innings average, the next year it was 14.2.
perhaps some future charts will only focus on pre/post ww2, will specify in title.
i just realised this i calculated all these averages as total/runs over number of innings and not total runs/number of outs.
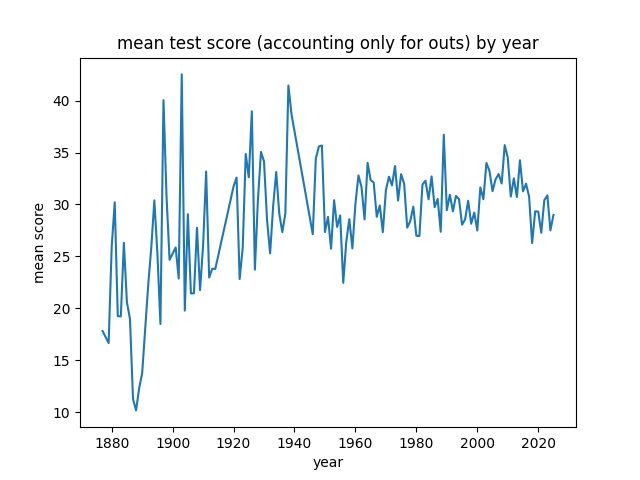
the left plots are virtually identical and looking at each innings, unsurprisingly the later the innings the bigger the improvement.
those 3 green points in the bottom left are years where there is no 4th innings wickets, nuts.